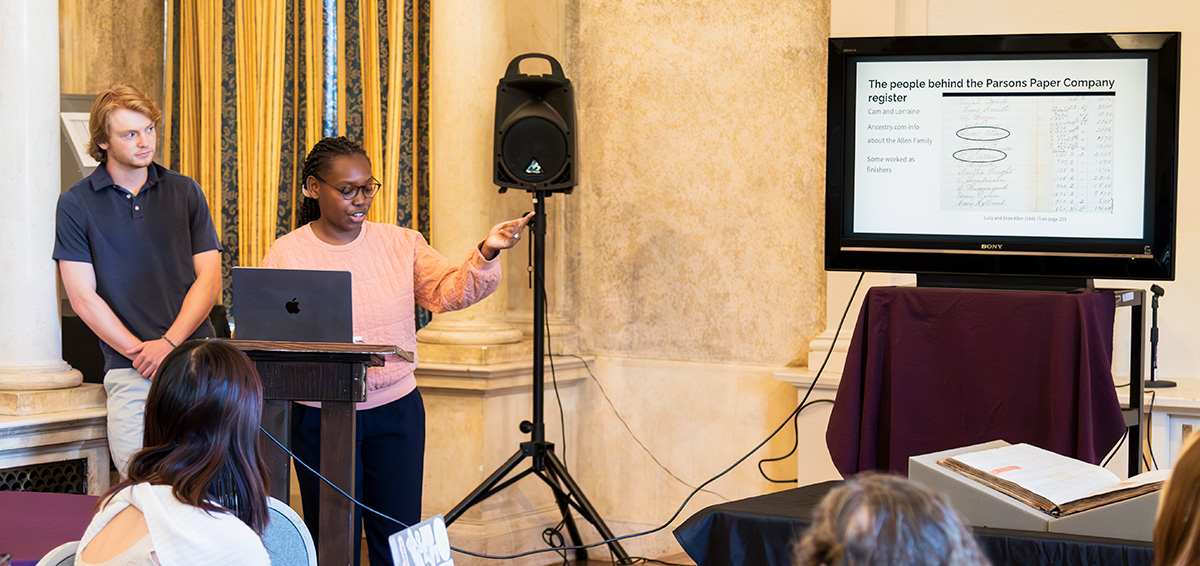
Camden Heafitz ’25 and Lorraine Oloo ’23 showed their genealogical research on the mill’s employees.
It was a fusion of both humanities and STEM,” one student wrote in their course reflection. “An unlikely combo of data science and the history of Holyoke, Mass.,” added another. And this from a third: “It was really cool.”
The course is Statistics 210: “Mining the History of Holyoke,” and it was taught last spring by Nicholas Horton, the Beitzel Professor in Technology and Society (Statistics and Data Science). Horton—who is also the vice president of the American Statistical Association—instructed six students. They are Sarah Edelson ’23, Camden Heafitz ’25, Kevin Jin ’23, Lorraine Oloo ’23, Nahia Pino ’25 and Anna Zhou ’25. They translated their findings into analytic reports, data visualizations, interactive web apps and more.
Their efforts were backed by a grant from the Data Science Corps, part of the National Science Foundation, which encourages student data scientists to analyze data for their local nonprofits. Holyoke was chosen because Horton had ties to Holyoke Community College and, as he said, “I fell in love with worker history and found so many gems in Holyoke.”
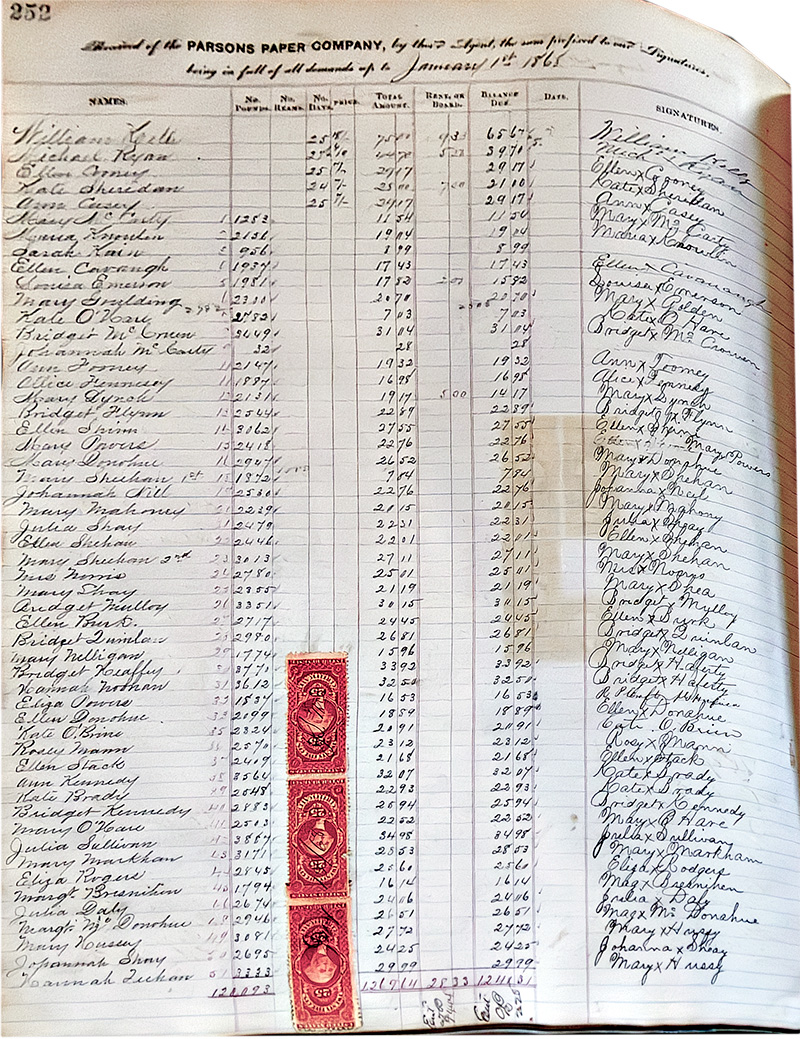
Students combed the Parsons Paper Co.’s payroll register.
The students dug into the 19th-century history of the Parsons Paper Co., Holyoke’s oldest and longest-running paper mill (1853–2005). They also focused on urban renewal in Holyoke in the 1960s and the papers of Carlos Vega, founder of the local advocacy group Nueva Esperanza.
Much of this hands-on work was conducted in Holyoke at the Wistariahurst Museum Archive. At the end of the course, the students presented their findings at a public event there, focusing on the paper mill. A few students had begun by paging their way through a fragile book containing several decades of Parsons payroll registers, from before and after the U.S. Civil War. Said Pino: “Parsons became the life’s blood of this town, and we wanted to make sure this book was accessible for all of time.” They digitized pages, created image files and launched an interactive GitHub web app.
As the students accumulated more data, it began to tell a story. They could trace patterns of employment, for instance, and wage rates. To wit: A boy working as a cutter of paper made $6.90 a week, a girl cutter $3.40. Illiterate employees—which the students determined by noting whose signature was just the letter X—were paid less than literate ones.
Heafitz and Oloo then did genealogical research to pin down family connections among the employees, and consulted Holyoke’s reverse directory to map where the employees lived. They transcribed hundreds of names—which can help future researchers. “For genealogical purposes,” said Horton, “this will be gold.”
Other class members then turned to the era’s municipal reports, and a public health narrative emerged. First came reports of diphtheria epidemics and then, around 1900, there appeared new government offices and positions: a board of plumbing; a city bacteriologist; and inspectors of milk, vinegar and petroleum.
“This is what truly lies at the heart of statistics,” said Horton. “It is important to always think of the human element behind all of our quantitative work.”
In one course reflection, a student reported being gratified to sharpen so many data science skills, including linear discriminant analysis and sentiment analysis. “As an added bonus,” the student wrote, “I learned how to read 1800s cursive pretty fluently.”
Photos by Jesse Gwilliam